
Dashboard in business intelligence – Dashboards in business intelligence have revolutionized the way organizations access, analyze, and visualize data, providing real-time insights that empower informed decision-making. These interactive tools offer a comprehensive overview of key performance indicators, trends, and patterns, enabling businesses to monitor progress, identify opportunities, and mitigate risks.
This guide delves into the world of dashboards in business intelligence, exploring their types, components, design considerations, data sources, use cases, and emerging trends. By understanding the fundamentals of dashboards, businesses can harness their full potential to gain a competitive edge and drive success.
Definition of Dashboard in Business Intelligence

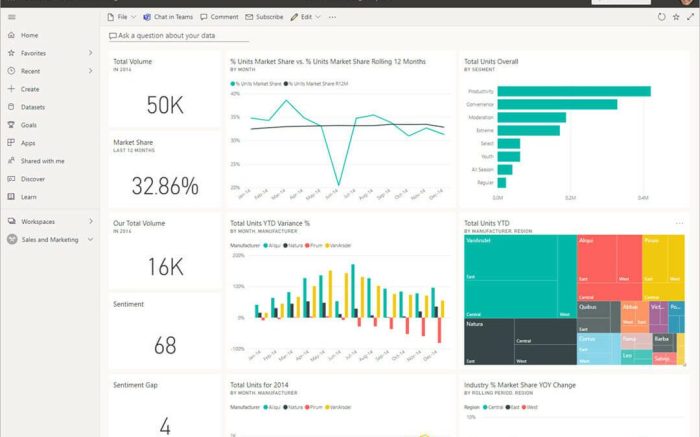
A dashboard in business intelligence (BI) is a visual representation of key performance indicators (KPIs) and metrics that provide a comprehensive overview of a business’s performance. It is a customizable tool that allows users to monitor data in real-time, identify trends, and make informed decisions.
Dashboards are essential tools for business intelligence, providing a centralized view of key performance indicators (KPIs) and other data that helps businesses make informed decisions.
To learn more about dashboards and other aspects of business intelligence, consider enrolling in one of the many business intelligence courses available online.
These courses can provide you with the skills and knowledge you need to effectively use dashboards and other business intelligence tools to improve your decision-making process.
Dashboards are designed to be easy to understand and navigate, enabling users to quickly access the information they need. They are typically used by executives, managers, and analysts to track progress towards goals, identify areas for improvement, and make data-driven decisions.
Types of Dashboards
There are various types of dashboards, each designed for a specific purpose or industry. Some common types include:
- Operational dashboards: Provide real-time data on key business processes and operations.
- Analytical dashboards: Allow users to explore data in depth, identify trends, and perform analysis.
- Strategic dashboards: Focus on long-term goals and provide insights for strategic decision-making.
- Executive dashboards: Provide a high-level overview of key metrics for executives and senior management.
- Industry-specific dashboards: Tailored to the specific needs of a particular industry, such as healthcare, finance, or manufacturing.
Components of an Effective Dashboard: Dashboard In Business Intelligence

Effective dashboards share several essential components:
- Clear goals and objectives: Dashboards should be aligned with specific business goals and objectives.
- Relevant data: Dashboards should include only the data that is most relevant to the target audience.
- Visualizations: Data should be presented in a visually appealing and easy-to-understand manner, using charts, graphs, and other visualizations.
- User interactivity: Dashboards should allow users to interact with the data, filter results, and drill down for more details.
- Customization: Dashboards should be customizable to meet the specific needs of different users and departments.
Design Considerations for Dashboards
When designing dashboards, it is important to consider the following best practices:
- Visual appeal: Dashboards should be visually appealing and easy to navigate.
- Layout: The layout should be organized and logical, with clear headings and sections.
- Color schemes: Color schemes should be chosen carefully to enhance readability and contrast.
- Font choices: Fonts should be easy to read and consistent throughout the dashboard.
- White space: White space should be used effectively to improve readability and avoid clutter.
Conclusion
In conclusion, dashboards in business intelligence have become indispensable tools for organizations seeking to leverage data for informed decision-making.
By carefully considering the types, components, design, data sources, and trends discussed in this guide, businesses can create effective dashboards that provide actionable insights, drive performance, and empower stakeholders to make data-driven decisions.
Popular Questions
What is the purpose of a dashboard in business intelligence?
Dashboards provide a real-time, visual representation of key performance indicators, trends, and patterns, enabling businesses to monitor progress, identify opportunities, and mitigate risks.
Dashboards in business intelligence provide a comprehensive view of key metrics and insights, enabling businesses to make informed decisions.
However, it’s important to distinguish between business intelligence and business analytics, which have distinct roles in data analysis.
Business intelligence vs business analytics focuses on historical data and current performance, while business analytics leverages predictive modeling and statistical analysis to forecast future outcomes.
Despite these differences, both disciplines contribute to the development of effective dashboards in business intelligence, empowering organizations to gain valuable insights and drive growth.
What are the different types of dashboards?
Dashboards can be categorized based on their functionality and purpose, such as operational dashboards, analytical dashboards, and strategic dashboards.
What are the essential components of an effective dashboard?
Effective dashboards include visualizations, data selection, user interactivity, and clear organization to provide actionable insights.
What are the best practices for designing dashboards?
Dashboards in business intelligence provide a centralized view of key performance indicators, making it easier to monitor progress and identify areas for improvement.
To get started with business intelligence, consider using business intelligence tools freeware. These tools can help you create dashboards and reports, and they can also provide insights into your data.
With the right tools, you can use business intelligence to make better decisions and improve your business performance.
Best practices for dashboard design include using visually appealing layouts, consistent color schemes, and appropriate font choices to enhance readability and user experience.
What are the emerging trends in dashboard development?
Emerging trends in dashboard development include the use of artificial intelligence, machine learning, and cloud computing to enhance data analysis, visualization, and user interaction.


