
Analytic business intelligence (BI) has emerged as a cornerstone of modern organizations, empowering them with data-driven insights to navigate the complexities of today’s business landscape. By harnessing the power of data analytics and visualization, BI tools provide a comprehensive understanding of business performance, enabling informed decision-making and competitive advantage.
Analytic business intelligence provides valuable insights into data, empowering businesses to make informed decisions. In healthcare, business intelligence plays a crucial role, enabling healthcare providers to improve patient care, optimize operations, and reduce costs.
By leveraging data analytics, healthcare organizations can gain insights into patient outcomes, identify trends, and make data-driven decisions that enhance the overall quality of healthcare services.
The integration of data analytics into BI has revolutionized the way organizations extract meaningful insights from vast amounts of data.
Techniques like data mining, statistical analysis, and machine learning uncover hidden patterns and trends, allowing businesses to identify opportunities, optimize operations, and mitigate risks.
Analytic business intelligence empowers organizations with data-driven insights, transforming raw data into actionable information. To fully grasp this concept, it’s crucial to describe business intelligence as a comprehensive process involving data collection, analysis, and visualization.
Through this understanding, analytic business intelligence becomes a powerful tool for businesses seeking to optimize decision-making and achieve competitive advantages.
Business Intelligence Fundamentals

Business intelligence (BI) refers to the process of collecting, analyzing, and presenting data to support informed decision-making in organizations.
BI tools and technologies enable businesses to gather data from various sources, transform it into actionable insights, and visualize it for effective communication.
Types of BI Tools and Technologies
- Data warehousing: Centralized repositories for storing and managing large volumes of data from multiple sources.
- Data mining: Techniques for extracting hidden patterns and relationships from data.
- Data visualization: Tools for creating interactive and visually appealing representations of data.
- Reporting tools: Software for generating reports and dashboards that summarize and present data.
Examples of BI Use Cases
- Predicting customer churn by analyzing customer behavior patterns.
- Optimizing marketing campaigns by identifying effective channels and target audiences.
- Improving operational efficiency by identifying bottlenecks and inefficiencies.
Data Analytics for BI
Data analytics plays a crucial role in BI by providing the means to extract meaningful insights from data. Various techniques are employed to analyze data, including:
Types of Data Analytics Techniques
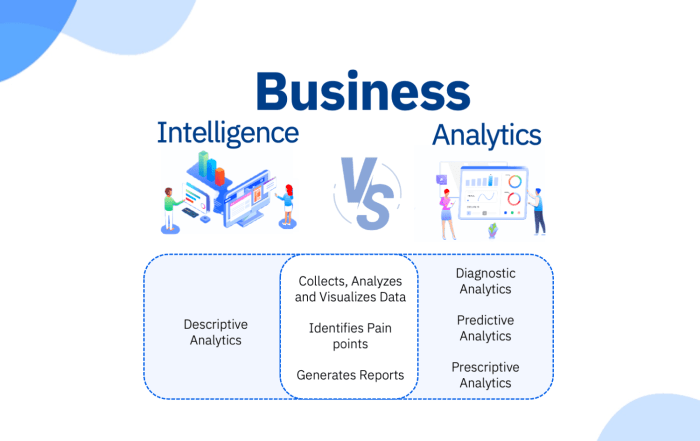
- Descriptive analytics: Summarizing and describing data to understand current performance.
- Diagnostic analytics: Identifying the root causes of problems and anomalies.
- Predictive analytics: Forecasting future outcomes based on historical data and patterns.
- Prescriptive analytics: Recommending actions to optimize outcomes.
Examples of Data Analytics in BI, Analytic business intelligence

- Identifying trends and patterns in customer behavior to predict future demand.
- Analyzing sales data to identify high-performing products and target profitable customers.
- Predicting equipment failures to optimize maintenance schedules and reduce downtime.
Data Visualization for BI
Data visualization is essential for communicating insights effectively in BI. Different techniques are used to represent data visually, including:
Types of Data Visualization Techniques
- Charts: Bar charts, line charts, pie charts, and other graphical representations of data.
- Graphs: Networks, trees, and other structures to visualize relationships and hierarchies.
- Maps: Geographic representations of data to identify spatial patterns and trends.
- Dashboards: Collections of visualizations that provide an overview of key performance indicators.
Examples of Data Visualization in BI
- Creating interactive dashboards to monitor key metrics and track progress towards goals.
- Using heat maps to visualize the distribution of data across geographic regions.
- Employing scatterplots to identify correlations and relationships between variables.
Challenges and Trends in BI: Analytic Business Intelligence
Implementing and using BI solutions come with challenges, including:
Challenges in BI
- Data quality and integration issues.
- Skills and resource constraints.
- Security and privacy concerns.
Emerging Trends in BI
- Artificial intelligence (AI) and machine learning (ML) for automating data analysis and insights generation.
- Self-service BI tools empowering business users to access and analyze data.
- Cloud-based BI solutions offering scalability and cost-effectiveness.
Recommendations for Overcoming Challenges and Leveraging Trends
- Invest in data quality initiatives.
- Develop a comprehensive data governance strategy.
- Train and upskill employees on BI tools and technologies.
- Explore AI and ML solutions to enhance data analysis capabilities.
- Adopt cloud-based BI solutions for scalability and flexibility.
Conclusion
Analytic business intelligence has become an indispensable tool for organizations seeking to thrive in the digital age. By embracing data-driven decision-making, businesses can gain a competitive edge, drive innovation, and achieve sustained growth.
As technology continues to evolve, the integration of AI and ML into BI solutions will further enhance their capabilities, unlocking even greater potential for data-driven success.
Analytic business intelligence provides organizations with the ability to make informed decisions by leveraging data and analytics. SAS business intelligence is a popular tool that empowers businesses with advanced analytics capabilities.
By seamlessly integrating with existing systems, SAS business intelligence enables organizations to extract meaningful insights from data, empowering them to optimize operations and drive growth.
General Inquiries
What is the role of data visualization in BI?
Data visualization plays a crucial role in BI by transforming complex data into visually appealing and easily understandable formats.
Charts, graphs, and dashboards enable stakeholders to quickly grasp key insights, identify trends, and make informed decisions.
How can BI help businesses improve decision-making?
BI provides a comprehensive view of business performance, enabling data-driven decision-making. By analyzing historical data, identifying patterns, and forecasting future trends, businesses can make informed choices that optimize outcomes and mitigate risks.

