Business intelligence and business analytics, two powerful tools that empower businesses to make data-driven decisions and gain a competitive edge, are transforming the way organizations operate. This comprehensive guide will delve into the world of BI and BA, exploring their definitions, differences, and practical applications.
Business intelligence and business analytics empower organizations to make informed decisions by leveraging data-driven insights. These insights are often harnessed by skilled business intelligence engineers, who play a pivotal role in the implementation and management of these technologies. By analyzing data, they identify trends, patterns, and opportunities that drive business growth.
The field of business intelligence and business analytics continues to evolve, offering a wealth of business intelligence engineer jobs for those seeking to make a meaningful impact on data-driven decision-making.
With the ever-growing volume of data available, BI and BA have become essential for businesses seeking to harness the power of information. From data sources and management to analysis and visualization, this guide will provide a thorough understanding of the key components involved in these disciplines.
Definition and Concepts: Business Intelligence And Business Analytics

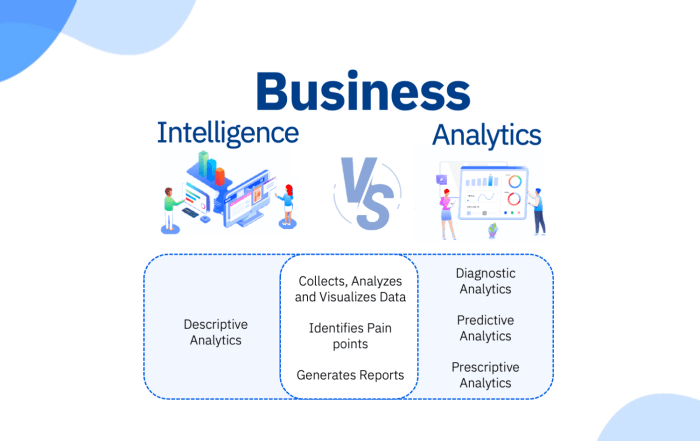
Business intelligence (BI) is the process of gathering, analyzing, and interpreting data to make better business decisions. Business analytics (BA) is the use of statistical and quantitative techniques to analyze data and make predictions.
The key difference between BI and BA is that BI is focused on providing descriptive and diagnostic insights, while BA is focused on providing predictive and prescriptive insights.
BI can be used to identify trends, patterns, and anomalies in data. This information can be used to make informed decisions about product development, marketing campaigns, and other business operations.
BA can be used to predict future events and trends. This information can be used to make informed decisions about risk management, investment strategies, and other business planning.
Data Sources and Management
The different types of data sources used in BI and BA include:
- Structured data: This data is organized in a tabular format, such as a spreadsheet or database.
- Unstructured data: This data is not organized in a tabular format, such as text, images, and videos.
- Semi-structured data: This data is a combination of structured and unstructured data, such as a customer contact record that includes both structured data (e.g., name, address) and unstructured data (e.g., notes).
Data quality is essential for BI and BA. Data that is inaccurate or incomplete can lead to misleading insights.
Business intelligence and business analytics provide valuable insights for data-driven decision-making. To facilitate this process, freeware business intelligence software offers cost-effective solutions for organizations seeking to leverage data analytics.
These tools empower businesses with the ability to explore, analyze, and visualize data, ultimately enhancing their understanding of market trends, customer behavior, and operational performance, thus enabling them to make informed decisions and gain a competitive edge.
Data management is the process of collecting, cleaning, and integrating data from different sources.
The methods and tools used for data integration and data cleansing include:
- Data integration tools: These tools can be used to combine data from different sources into a single, consistent dataset.
- Data cleansing tools: These tools can be used to identify and correct errors in data.
Data Analysis and Visualization
The techniques and methods used for data analysis include:
- Descriptive statistics: These statistics describe the central tendency, variability, and distribution of data.
- Inferential statistics: These statistics allow you to make inferences about a population based on a sample.
- Predictive analytics: These techniques use data to predict future events.
- Prescriptive analytics: These techniques use data to recommend actions that should be taken.
Data visualization is the process of representing data in a graphical format.
Data visualization can help you to identify trends, patterns, and anomalies in data.
The different types of data visualization tools include:
- Charts: These are used to display data in a graphical format.
- Graphs: These are used to display data in a line or bar format.
- Maps: These are used to display data on a map.
Business Applications, Business intelligence and business analytics
The key business applications of BI and BA include:
- Customer relationship management (CRM): BI and BA can be used to identify and track customer behavior, preferences, and trends.
- Supply chain management (SCM): BI and BA can be used to optimize the supply chain, reduce costs, and improve customer service.
- Risk management: BI and BA can be used to identify and mitigate risks.
- Fraud detection: BI and BA can be used to detect and prevent fraud.
- Financial planning and analysis: BI and BA can be used to plan and analyze financial performance.
BI and BA can improve decision-making by providing insights into data that would not be possible to obtain manually.
For example, BI and BA can be used to identify trends in customer behavior that can be used to develop more effective marketing campaigns.
Challenges and Trends
The challenges associated with BI and BA implementation include:
- Data quality: Data quality is essential for BI and BA. Data that is inaccurate or incomplete can lead to misleading insights.
- Data integration: Data integration can be a complex and time-consuming process.
- Data analysis: Data analysis can be complex and requires specialized skills.
- Data visualization: Data visualization can be complex and requires specialized skills.
The emerging trends in BI and BA include:
- Big data: Big data is a term used to describe datasets that are too large and complex to be processed by traditional data processing tools.
- Cloud computing: Cloud computing is a model for delivering computing services over the Internet.
- Artificial intelligence (AI): AI is the use of computer systems to perform tasks that normally require human intelligence.
The future of BI and BA is bright. As data becomes increasingly important, BI and BA will become increasingly valuable.
Outcome Summary

In conclusion, business intelligence and business analytics are indispensable tools for businesses looking to make informed decisions, improve efficiency, and gain a competitive advantage. As technology continues to advance, BI and BA will undoubtedly play an increasingly vital role in shaping the future of business.
FAQ Overview
What is the difference between business intelligence and business analytics?
Business intelligence focuses on providing historical and current data to help businesses understand their performance, while business analytics involves using advanced techniques to analyze data and predict future trends.
What are the benefits of using business intelligence and business analytics?
Business intelligence and business analytics provide organizations with valuable insights into their operations. If you’re looking to enhance your skills in this field, consider enrolling in business intelligence courses.
These courses will equip you with the knowledge and tools necessary to gather, analyze, and interpret data, enabling you to make informed decisions that drive business success.
Ultimately, business intelligence and business analytics empower organizations to gain a competitive edge and achieve their goals.
BI and BA can help businesses improve decision-making, optimize operations, identify new opportunities, and gain a competitive advantage.
What are the challenges of implementing business intelligence and business analytics?
Common challenges include data quality issues, lack of skilled professionals, and resistance to change within organizations.


